

- HOME
- Research
- Research Archives
- RCAST LAB tours
- Nakamura/Kosaka Laboratory Exploring climatic variation with “virtual Earth”
Nakamura/Kosaka Laboratory
Exploring climatic variation with “virtual Earth”
- Sweltering summers and severe winters, torrential downpours and their resulting natural disasters… The media often reports news about abnormal weather and global warming. Why do the climate and weather undergo such extreme variations? To what degree are they predictable? We visited the Nakamura/Kosaka Laboratory, which studies climatic variation mechanisms and simulations.
The 2010 summer was supposed to be a cool one due to El Niño, but…
El Niño –a climate event that features abnormal ocean surface warming along the equator in the East Pacific and occurs once per several years– is considered to weaken the Pacific subtropical high and bring a cool summer to Japan. “Tropical oceans and atmosphere fluctuate together during an El Niño episode. Its development can be predicted several months in advance”, says Associate Professor Kosaka. So why was the summer of 2010 so hot? “Climate varies not by the atmosphere alone, but in combination with many components such as oceans and ice, in complex ways, causing tiny, coincidental changes to turn into major shifts. El Niño, which occurs off the coast of Peru during winter, does have an important remote impact on the Japanese summer, despite the geographical and temporal distance between them. But it isn’t the only factor for abnormal weather. Some of origins of abnormal weather are predictable, but some others are not. If the unpredictable phenomena are dominant, prevailing theories are overturned, resulting in what we’ve seen in the summer of 2010. That year the El Niño-based predictions were correct until early June. From July onwards, the ‘unpredictable aspects’ became dominant.”
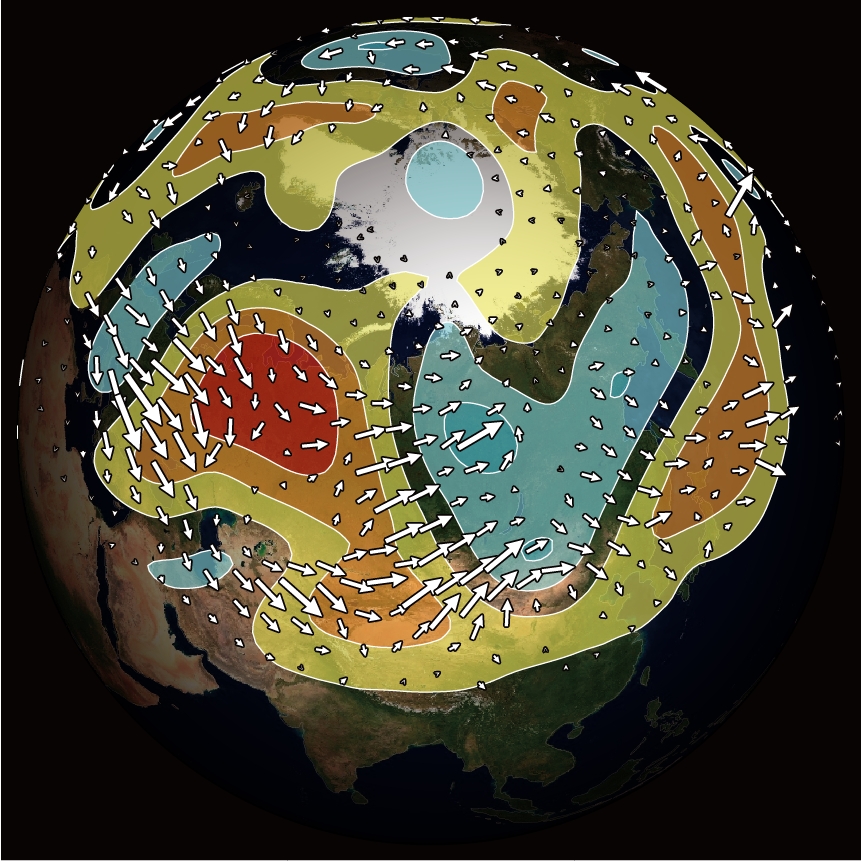
Climate fluctuations consist of climate change and climate variability. Climate change is brought about by external factors such as greenhouse gas emissions, while climate variability are natural swings that are unrelated to CO2 emissions or other results of human activity. The Nakamura/Kosaka Laboratory focuses primarily on climate variability. “You can’t perform fluctuation experiments on the earth itself, right? That’s why we perform simulations on a virtual Earth and use a massive amount of its output," says Professor Nakamura. The virtual Earth, whose calculations are performed on a computer as directed by a program, is called a climate model.
-
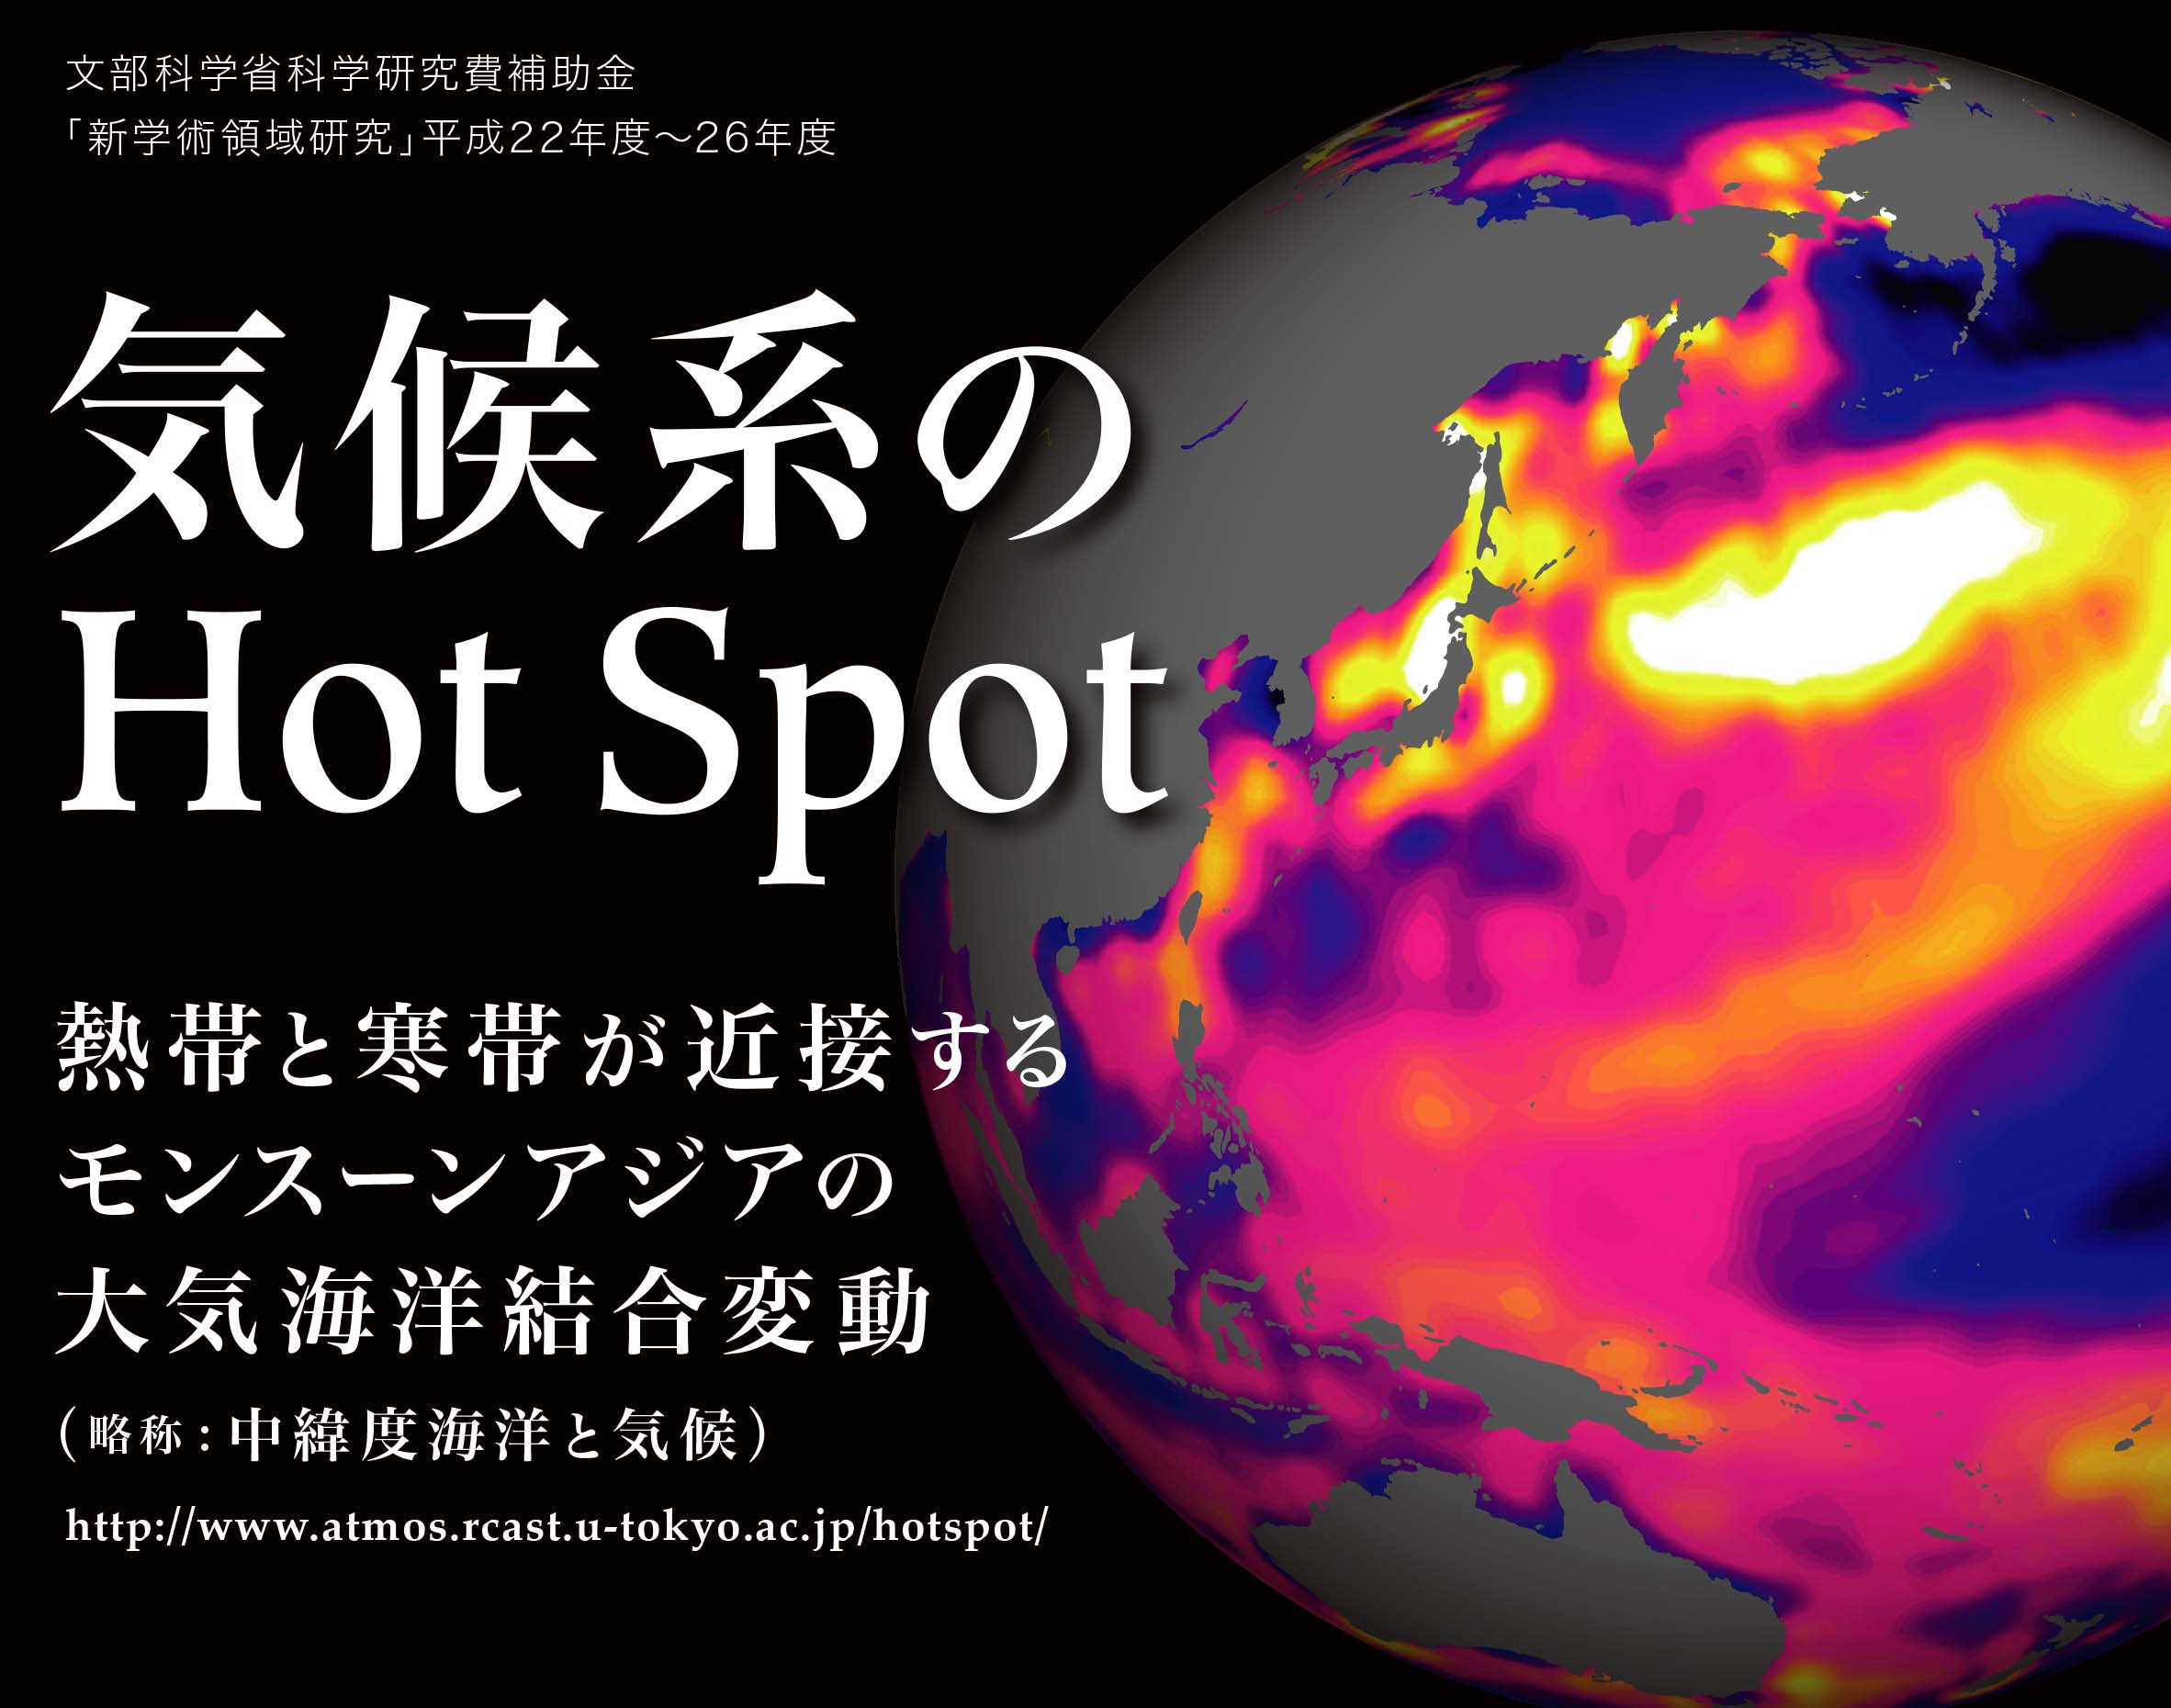
“Hot Spot in Climate System” Grant-in-Aid for Scientific Research in Innovative Areas (2010—2014), overseen by Professor Nakamura. The primary target area of this project was the Far East and western North Pacific, where the most distinct "hot-spot" in the extratropical climate system is situated. Under the "interface" between the tropical heat and the polar cold caused by the Kuroshio and Oyashio Currents and the East Asian Monsoon, there are various interactive phenomena in the atmosphere and ocean (including sea ice) that are involved in the release of a huge amount of heat and moisture from the ocean into the atmosphere. The researchers strove to depict such phenomena and understand the underlying mechanisms

Reproducing the past and foreseeing the future
Classically, it has been considered that influence of climate variability generated in the tropics are conveyed through the atmosphere to mid-latitude areas such as Japan, and mid-latitude oceans merely passively respond. “When I was studying in the US, almost everyone around me was studying changes in the tropics and their remote impact. I’m a bit of a contrarian, so I focused on the mid-latitudes (laughs). We’ve now discovered that mid-latitude oceans are not just passively influenced by changes in the tropics, but that changes in mid-latitude oceans also affect the atmosphere above, and they have even more far-reaching effects,” explains Professor Nakamura. In July 2014 he revealed that seasonal increases in the temperature of the East China Sea are an important factor on the timing of the devastating heavy rains of the Baiu season in Kyushu. As global warming progresses, and temperatures in the East China Sea rise more, by the end of the century heavy rains may begin earlier in season with even more amount of rainfall. This has been picked up throughout the media as extremely significant in creating social adaptation strategy for preventing or reducing the impact of disasters.
Associate Professor Kosaka, on the other hand, studies the tropics and their impact on mid-latitude regions.“Within this lab, I’m the contrarian.” A research group including Associate Professor Kosaka reconstructed climate observation data for the past 117 years, dating back to 1897, before the modern climate observation system was created. In July 2015 they released the results of their long-run analysis, based on this dataset, on the remote influence that brings abnormal weather to Japanese summers. For this study the group gathered and digitized printed climate materials from archives in the Japan Meteorological Agency, Philippines, Taiwan, Shanghai, and the U.S. Library of Congress. The results of this research have the potential to make major contributions to seasonal forecasting of abnormal summer weather, such as typhoon and extreme hot and cool summers, which have a tremendous impact on the lives and agriculture of the people of Japan and other East Asian countries.
The simulations used in weather forecasting have made striking advances in recent years. So it is often assumed possible to create high precision global warming forecast. But as Professor Nakamura puts it, “The future is in humanity’s hands.”
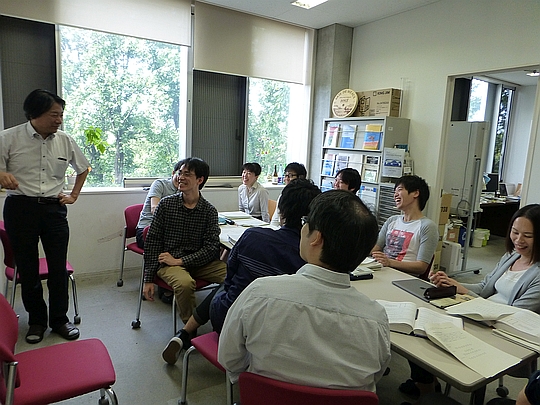
Researchers are smiling, but actually Professor Nakamura points out an error on an equation
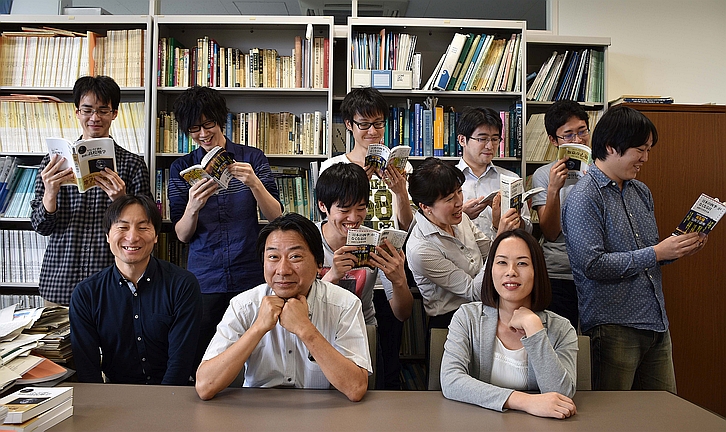
The students suggested holding the books Professor Nakamura authored for the laboratory photo, but he wasn’t on board, saying“It would look like trying too hard…”He eventually gave in to the pressure, resulting in this wonderful photo.
Climate simulations provide information for decisions
“Predictions based on climate simulation always suffer from uncertainty. We don’t know what is going to happen with regards to CO2 emissions as the result of human activity, and volcanic eruptions and the like also affect the climate. Numerical forecasts are also always affected by the ‘butterfly effect,’ in which small differences result in major deviations,” explains Professor Nakamura. Associate Professor Kosaka adds, “Of course we are working to increase the precision of our forecasts, but part of our work is to provide society with the information used to make decisions, such as how much of an impact it would have if CO2 levels rose to a certain point.” In other words, it is a scenario-based analysis instead of forecasting. “The precision of climate models has risen quite high, but the data used in actual predictions is slightly different from the truth at the point when observation is performed. For example, water temperature data is necessary to forecast rainfall, and in recent years satellites have become able to detect fine structure of water temperature changes. But the level of detail still isn’t high enough. We’re worried about a possibility that wrong information is being provided for forecasting heavy rains and fog in coastal areas.” According to Professor Nakamura, the seas around Japan are growing progressively warmer. “I think we’re going to start seeing the impact of that, especially in changes in rainfall patterns. We’d like to use the latest research results to reevaluate how ocean warming is influencing the extreme weather we’re experiencing, and how oceans and the atmosphere mutually influence each other and create atmospheric circulation.”
Four of the five hottest summers Japan has experienced have happened during the Heisei era, which began in 1989, and three of them have been in the last five years (at 2015 when this article is written). How hot will Japan get? “According to current observation data, the climate has been in a so-called “hiatus” of global warming, in which warming has stalled for 15 years. We showed that natural climate swing in the tropical Pacific has contributed to this stalling. And this tropical Pacific variability makes Japanese summers hot and winters cold. When warming resumes, Japanese summers may not be so hot for a while. However,” continues Associate Professor Kosaka, “as warming further progresses, and a similar stalling happens again, there may be years with even more severe summers than Japan is having these years. I’ve mainly studied summer so far, but I would like to expand research focus to include other seasons and study the mechanisms of abnormal weather in East Asia including Japan, and how to predict them. There’s a lot left to do, such as examining the impact of the tropics and outside areas, and determining what can be predicted and what cannot.”
Clouds are atmospheric phenomena that are particularly difficult to reproduce with climate models. Professor Nakamura says, “Clouds that stay in the lowest reaches of the atmosphere, in particular, cool the planet, so we’d like to perform joint research with cloud specialists.” The Nakamura/Kosaka Laboratory fields numerous questions from the media throughout the year. Updrafts of ardor and busyness will continue to gain intensity.
What is “climate simulation”?
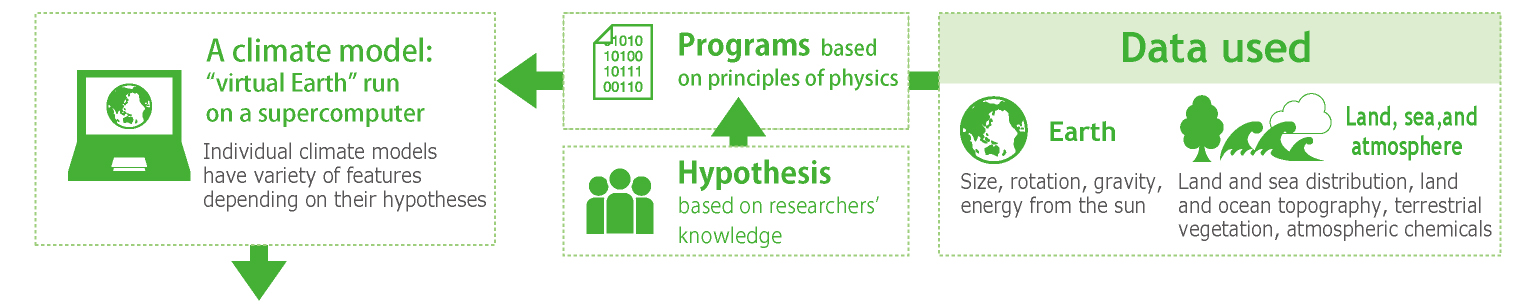
Simulation using a climate model with multiple initial values

Simulation results vary depending on initial values

Multi-model ensemble method which combines multiple models and takes the averages
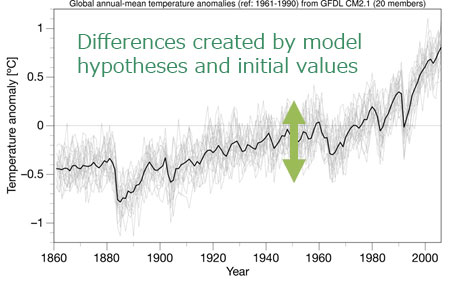
The values reported by the media are often the averages of the results produced by multiple models
Researcher Profile
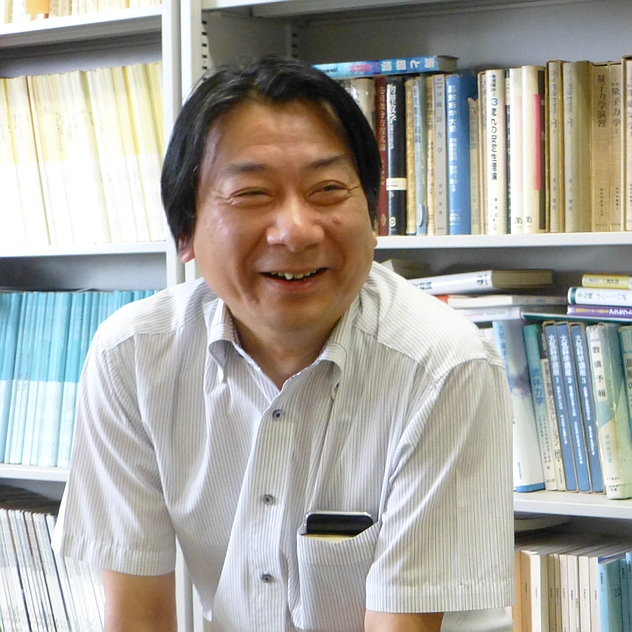
- As a graduate student, Professor Nakamura says he hiked through the mountains with a radio and weather chart paper, drawing up weather charts. “After all, the weather in the mountains is dangerous because it can change at the drop of a hat!” he laughs. He has been a steadfast devotee of weather charts since he was in junior high school. The former junior weather chart enthusiast gleefully explains, “Looking at a weather chart gives me a fascinating bird’s eye view of what the area you’re in looks like from above!” According to Associate Professor Kosaka, however, at the research lab Professor Nakamura is strict about how students choose words. “The Japanese is ambiguous when it comes to cause and effect relationships and so on, so using the language incorrectly can lead to incorrect inferences and interpretations in research, which can cause serious problems,” Professor Nakamura explains. When it comes to interaction with overseas researchers, he favors the use of nonverbal karaoke.
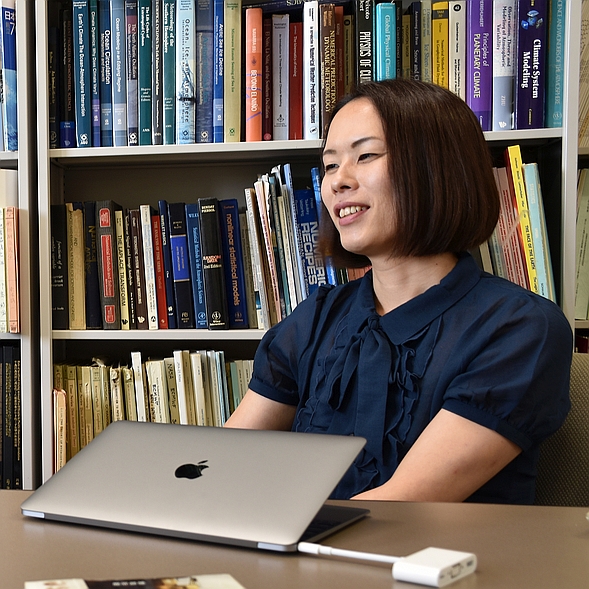
- Associate Professor Kosaka was formerly a student researcher at the Hisashi Nakamura Laboratory. Professor Nakamura has high hopes for her, saying “Her PhD dissertation was excellent. She is going to expand the potential of the research lab and broaden the territory it covers.” Associate Professor Kosaka began as a fan of theoretical physics, which led her to want to do research in this field which uses the principles of physics to forecast the future. “The issue of global warming rose to prominence when I was in junior high. The editor in chief of a magazine Newton, of which I was an avid reader, was a geophysicist, so that may have been what influenced me.” Associate Professor Kosaka, who appears reserved, has a surprising side. “When I get nice numbers as I expected, I get a big grin on my face while I look at the graph. When we reproduced the global temperature of the hiatus, I spent the whole weekend staring at the graphs (laughs)."
Tags
